Attaching package: 'scales'

The following object is masked from 'package:purrr':

    discard

The following object is masked from 'package:readr':

    col_factor
Rows: 2284 Columns: 4
── Column specification ────────────────────────────────────────────────────────
Delimiter: ","
chr (2): breed_reg, breed_imp
dbl (1): animal_id
lgl (1): is_match

ℹ Use `spec()` to retrieve the full column specification for this data.
ℹ Specify the column types or set `show_col_types = FALSE` to quiet this message.
Rows: 105 Columns: 6
── Column specification ────────────────────────────────────────────────────────
Delimiter: ","
chr (2): category, group
dbl (4): observed, expected, residual, percent_diff

ℹ Use `spec()` to retrieve the full column specification for this data.
ℹ Specify the column types or set `show_col_types = FALSE` to quiet this message.
Rows: 182 Columns: 12
── Column specification ────────────────────────────────────────────────────────
Delimiter: ","
chr (3): suburb, local_board, region
dbl (9): attacks_suburb, attacks_board, attacks_region, known_suburb, known_...

ℹ Use `spec()` to retrieve the full column specification for this data.
ℹ Specify the column types or set `show_col_types = FALSE` to quiet this message.
Rows: 231 Columns: 10
── Column specification ────────────────────────────────────────────────────────
Delimiter: ","
chr (3): suburb, local_board, region
dbl (7): impounds_suburb, impounds_board, impounds_region, known_board, know...

ℹ Use `spec()` to retrieve the full column specification for this data.
ℹ Specify the column types or set `show_col_types = FALSE` to quiet this message.
Rows: 127 Columns: 10
── Column specification ────────────────────────────────────────────────────────
Delimiter: ","
chr (3): suburb, local_board, region
dbl (7): impounds_attack_suburb, impounds_attack_board, impounds_attack_regi...

ℹ Use `spec()` to retrieve the full column specification for this data.
ℹ Specify the column types or set `show_col_types = FALSE` to quiet this message.
Rows: 122 Columns: 6
── Column specification ────────────────────────────────────────────────────────
Delimiter: ","
chr (3): region, local_board, status
dbl (3): count, board_total, proportion

ℹ Use `spec()` to retrieve the full column specification for this data.
ℹ Specify the column types or set `show_col_types = FALSE` to quiet this message.
Rows: 1248 Columns: 11
── Column specification ────────────────────────────────────────────────────────
Delimiter: ","
chr (4): suburb, local_board, region, metric
dbl (7): count, known_suburb, known_board, known_region, p_suburb, p_board, ...

ℹ Use `spec()` to retrieve the full column specification for this data.
ℹ Specify the column types or set `show_col_types = FALSE` to quiet this message.
Rows: 154 Columns: 8
── Column specification ────────────────────────────────────────────────────────
Delimiter: ","
chr (6): Census year, Local board area, Local board area Code, Measure, Valu...
dbl (1): Value
lgl (1): Null Reason

ℹ Use `spec()` to retrieve the full column specification for this data.
ℹ Specify the column types or set `show_col_types = FALSE` to quiet this message.
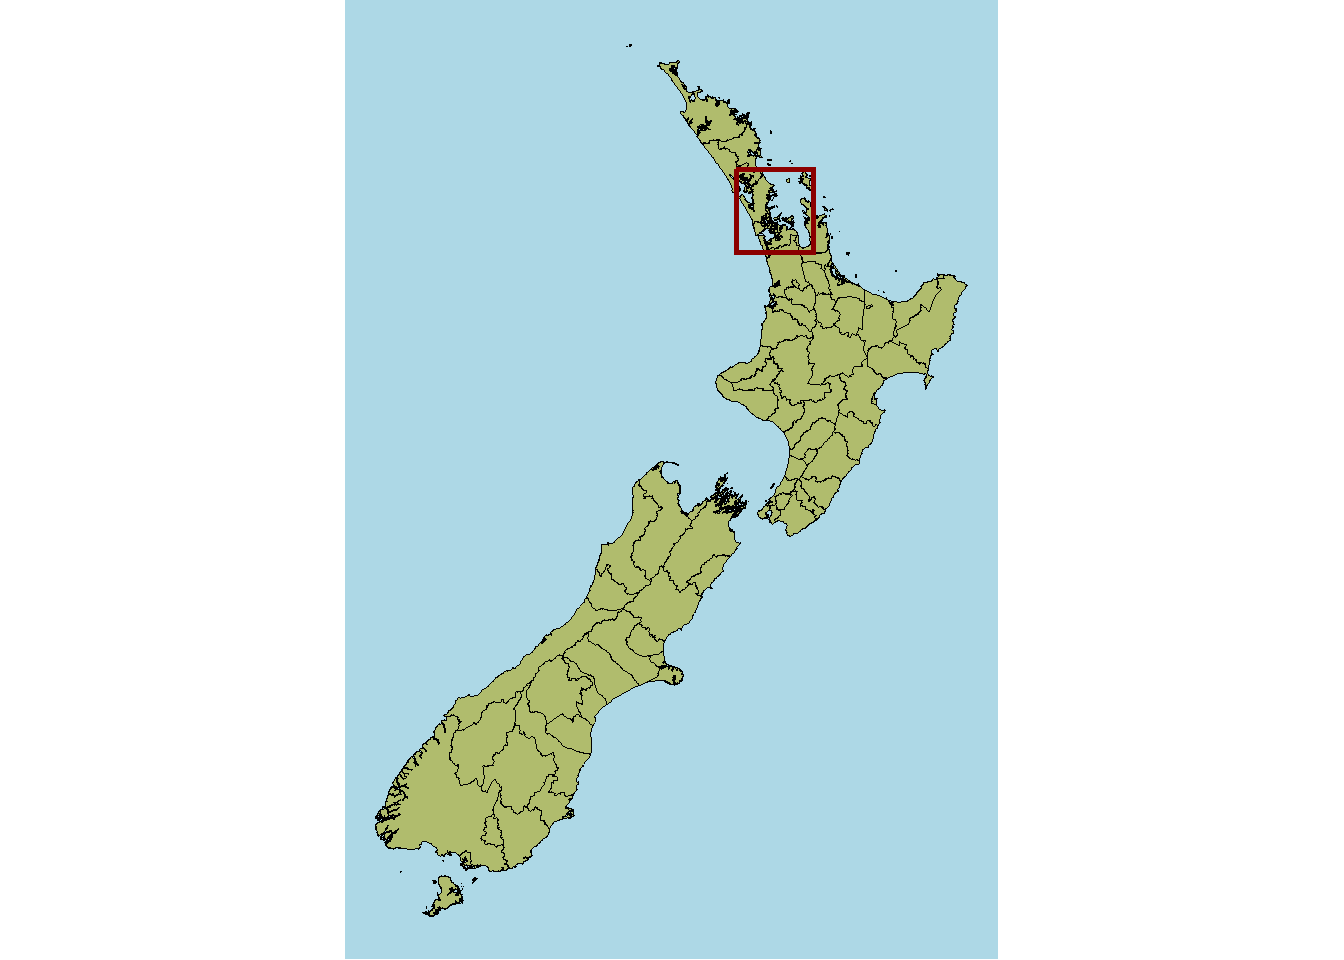
Import NZ map shapefile with local board divisions
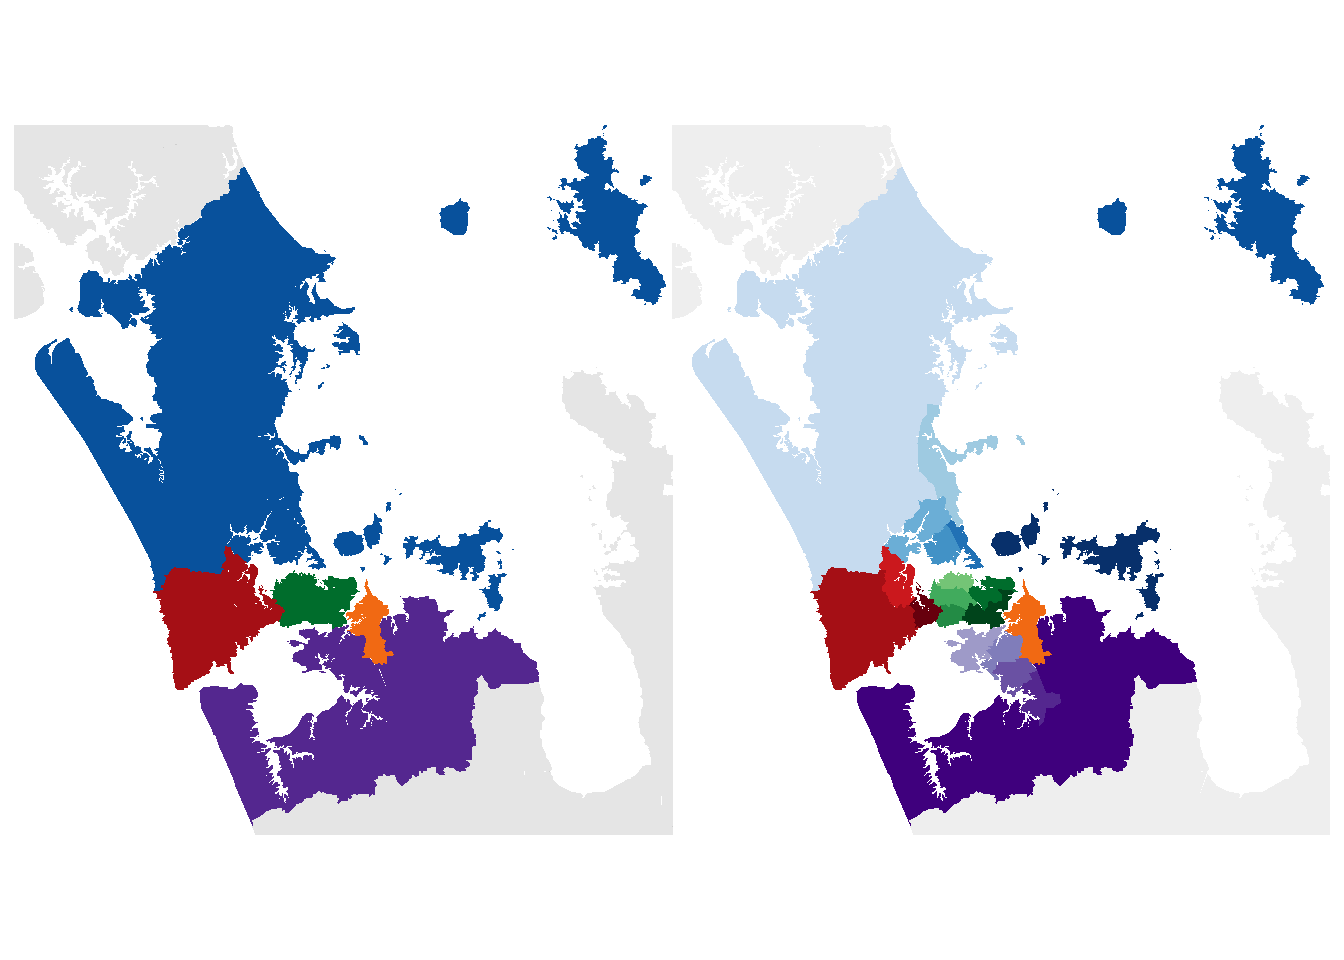
Left: Auckland regions (North = blue, West = red, Central = green, East = orange, South = purple). Right: Auckland’s 21 Local Boards, coloured based on their parent region.
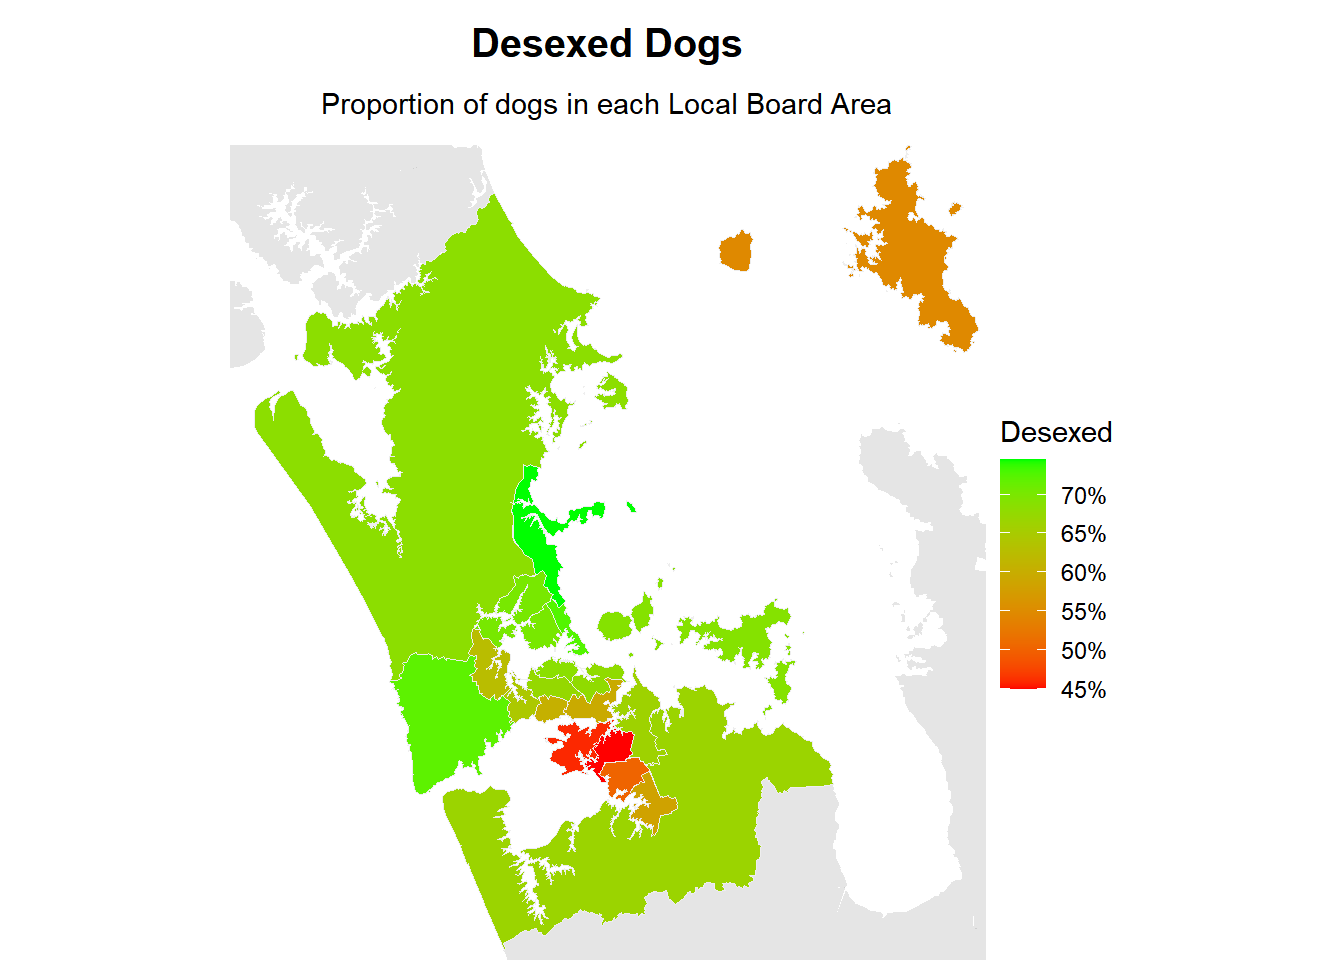
Proportion of desexed dogs by Local Board
In [10]:
map_desex <- auckland |>left_join(regional_data$regions_reg |>filter(metric =="animal_desexed"), by =join_by(local_board)) |>select(local_board, p_board, geometry) |>unique() |>filter(!is.na(p_board))plot_local_board(auckland, map_desex, p_board,"Desexed Dogs","Proportion of dogs in each Local Board Area") +scale_fill_gradient(low ="red",high ="green",name ="Desexed",labels =label_percent())
Scale for fill is already present.
Adding another scale for fill, which will replace the existing scale.
Proportion of dogs with a classification under the Dog Control Act by Local Board
In [11]:
map_class <- auckland |>left_join(regional_data$regions_reg |>filter(metric =="classification"), by =join_by(local_board)) |>select(local_board, p_board, geometry) |>unique() |>filter(!is.na(p_board))plot_local_board(auckland, map_class, p_board,"Menacing & Dangerous Dogs","Proportion of dogs in each Local Board Area","Classifications",label_percent())
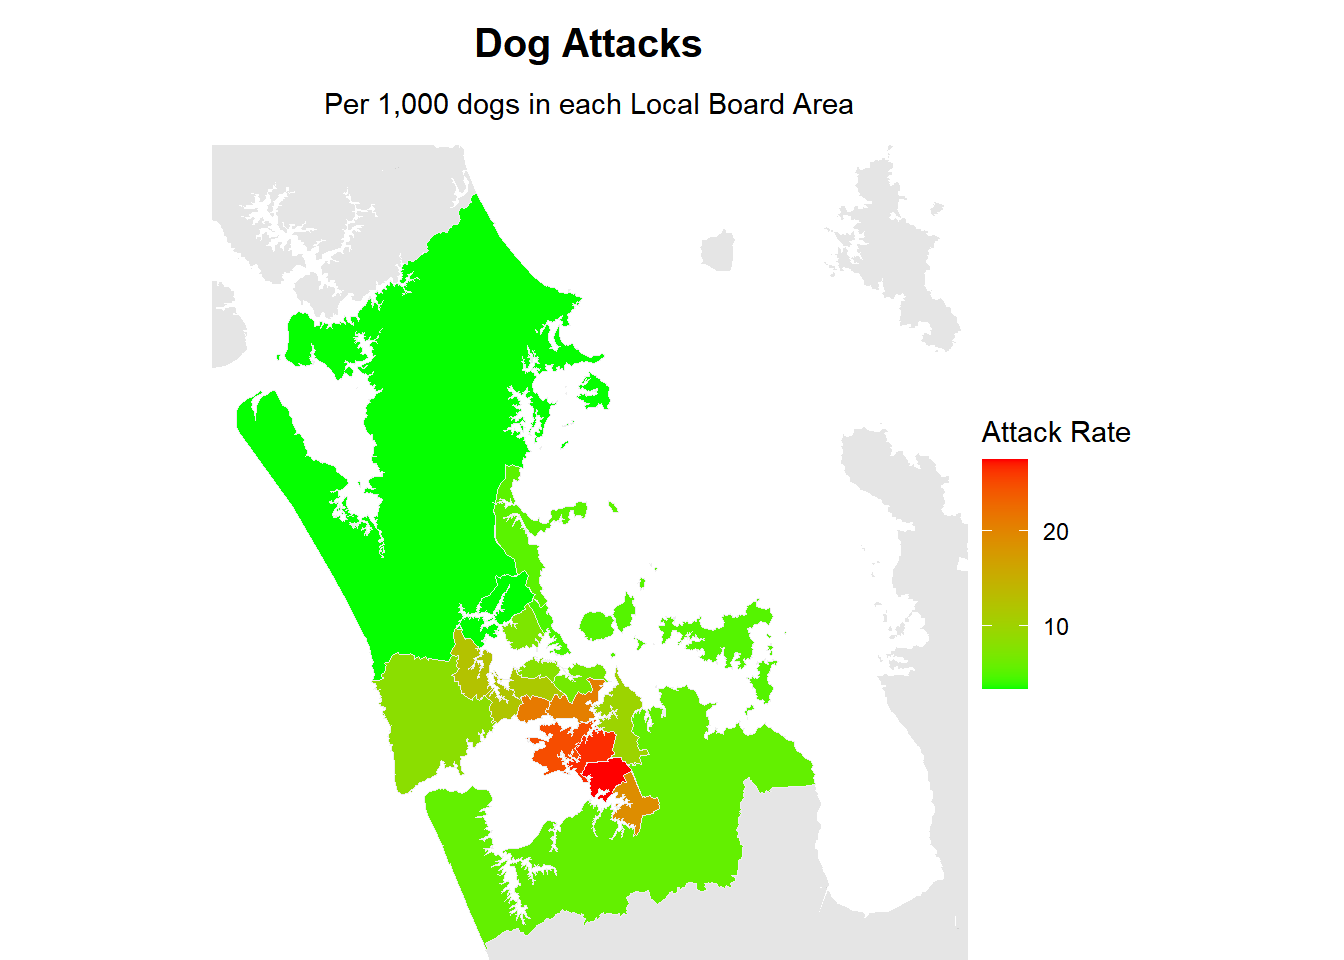
Rate of dog attacks by Local Board
In [12]:
map_attacks <- auckland |>left_join(regional_data$regions_attacks |>select(local_board, rate_board) |>unique(),by =join_by(local_board)) |>select(local_board, rate_board, geometry) |>filter(!is.na(rate_board))plot_local_board(auckland, map_attacks, rate_board,"Dog Attacks","Per 1,000 dogs in each Local Board Area","Attack Rate")
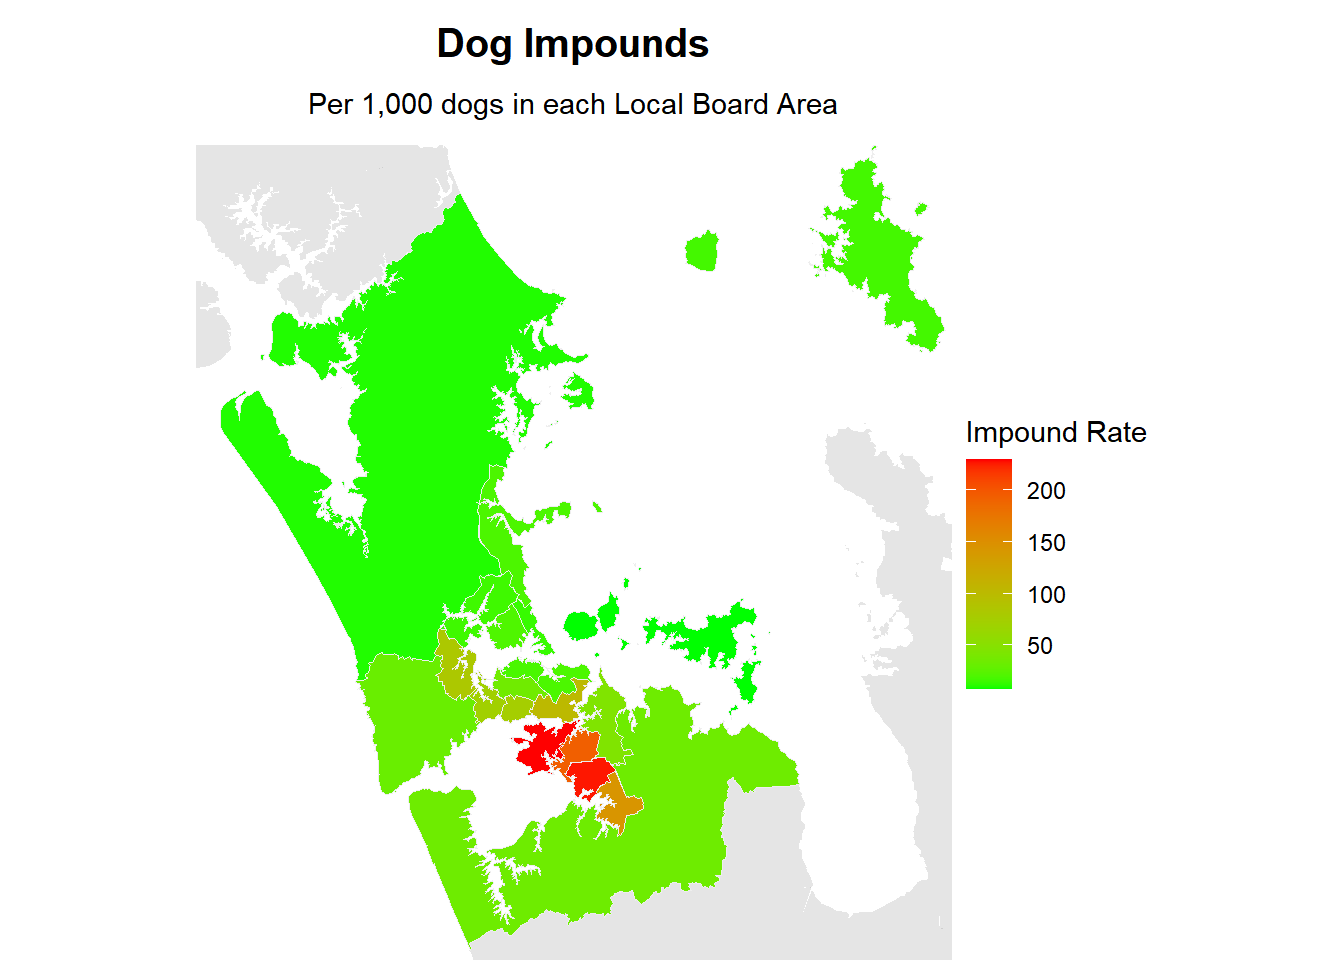
Rate of dog impounds by Local Board
In [13]:
map_impounds <- auckland |>left_join(regional_data$regions_impounds, by =join_by(local_board)) |>select(local_board, rate_board, geometry) |>unique() |>filter(!is.na(rate_board))plot_local_board(auckland, map_impounds, rate_board,"Dog Impounds","Per 1,000 dogs in each Local Board Area","Impound Rate")
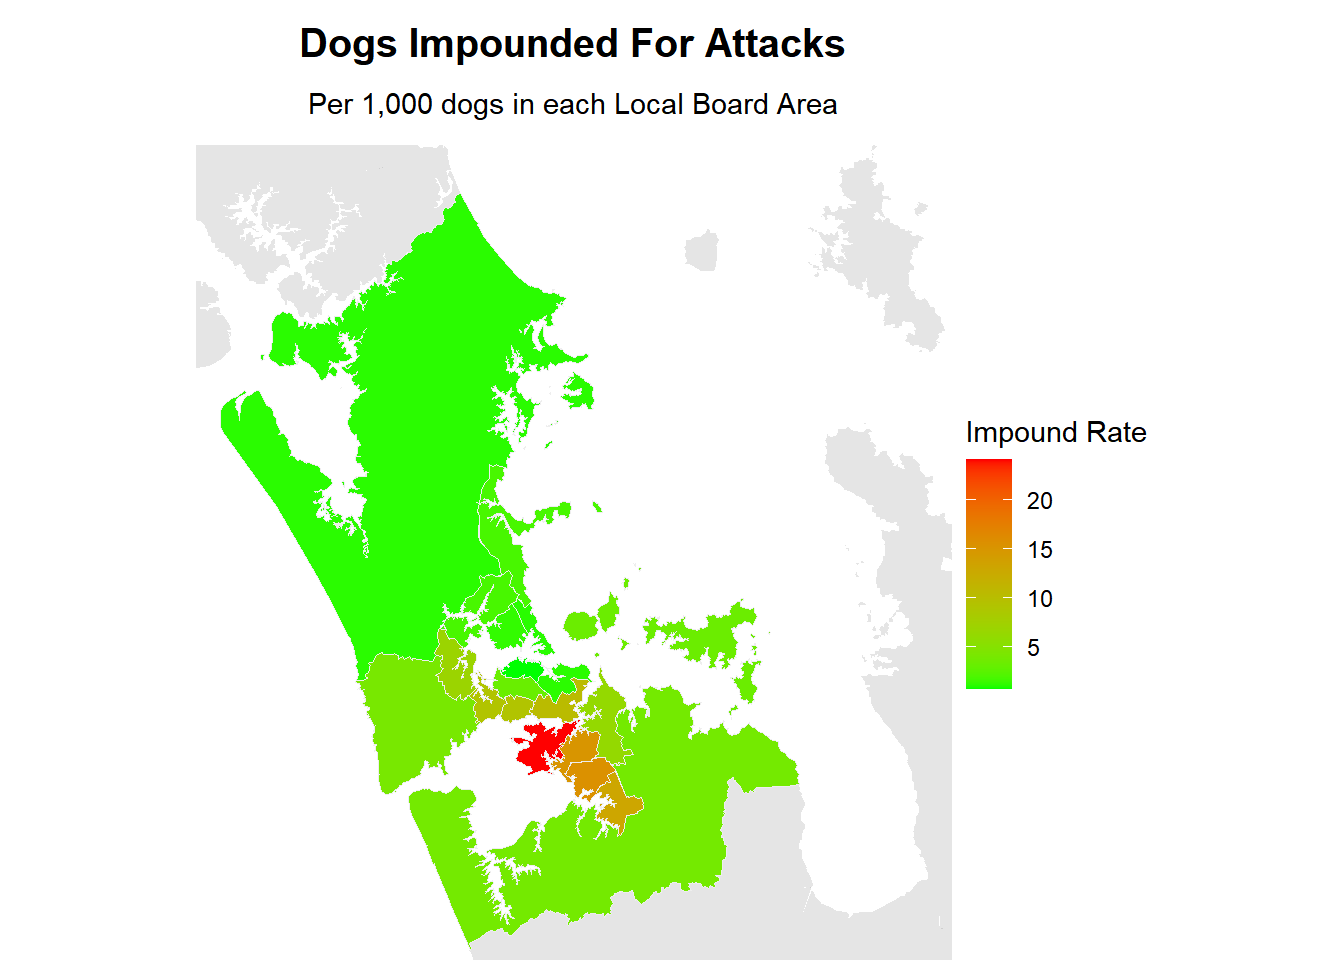
Rate of dog impounds due to attacks on people by Local Board
In [14]:
map_impounds_attacks <- auckland |>left_join(regional_data$regions_impounds_attacks, by =join_by(local_board)) |>select(local_board, rate_attack_board, geometry) |>unique() |>filter(!is.na(rate_attack_board))plot_local_board(auckland, map_impounds_attacks, rate_attack_board,"Dogs Impounded For Attacks","Per 1,000 dogs in each Local Board Area","Impound Rate")
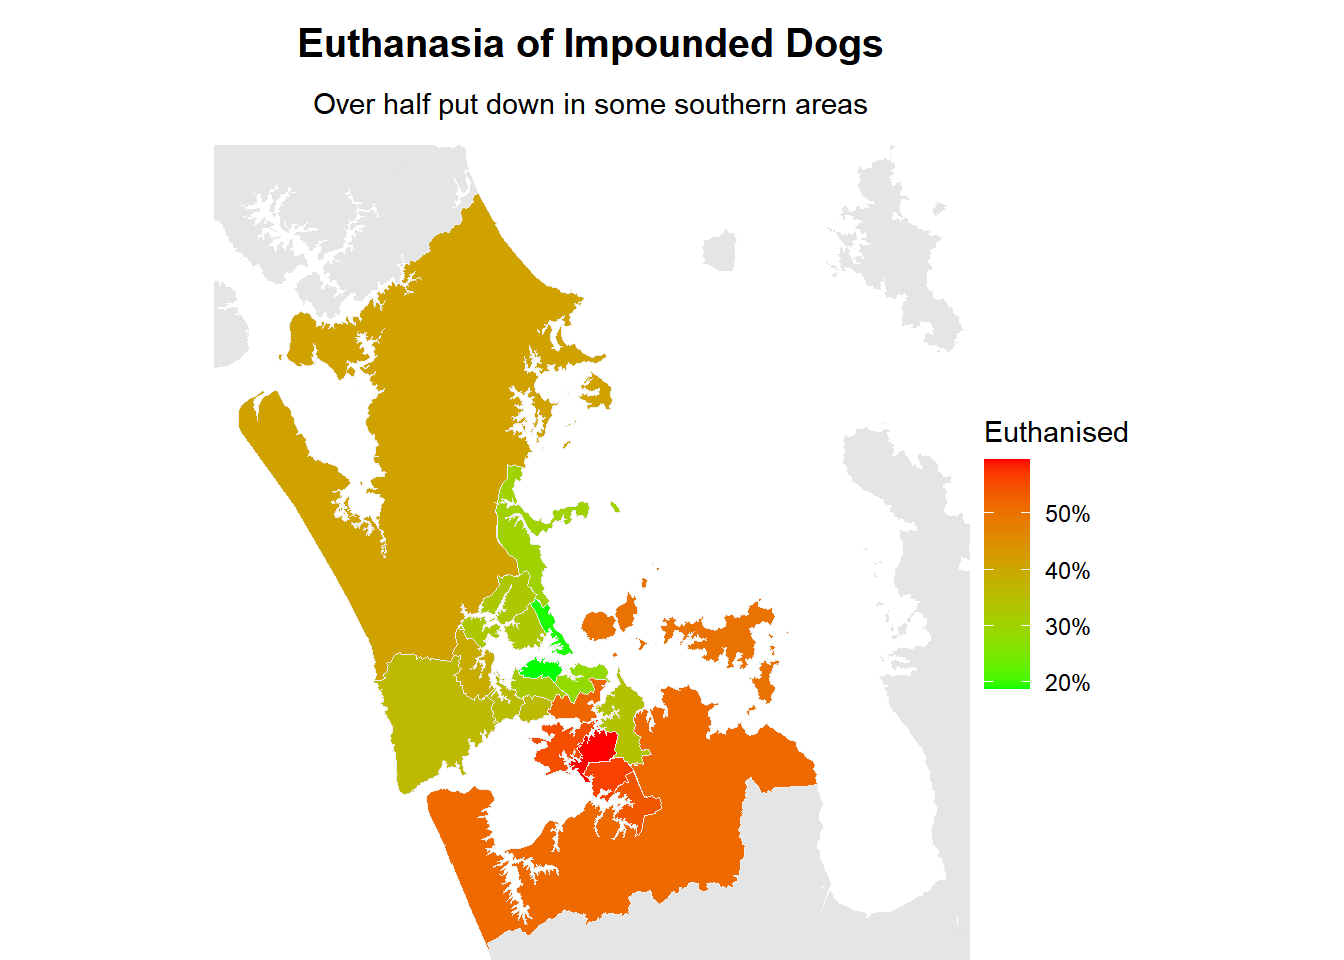
Proportion of impounded dogs euthanised by Local Board
In [15]:
map_impounds_euthanised <- auckland |>left_join(regional_data$regions_impounds_outcome, by =join_by(local_board)) |>select(local_board, status, proportion, geometry) |>unique() |>filter(status =="Euthanised"& local_board !="Aotea/Great Barrier Local Board Area")plot_local_board(auckland, map_impounds_euthanised, proportion,"Euthanasia of Impounded Dogs","Over half put down in some southern areas","Euthanised",label_percent())